

The relationship between return and risk is widely acknowledged in investing – but, do we really give enough thought to the risks we take when we invest our money? Probably not. This is because risk is difficult to conceptualise and it’s most often not portrayed in ways that are very clear, nor apply directly to us.
When investment products are marketed to us, the obvious objective is to entice us to buy them, hence they need to look attractive. If the provider focuses too much on the risks, it may put us off. This is notwithstanding that financial services provider laws require certain minimum disclosures.
A big risk is that the product may not perform to our expectations. These expectations are typically formed based on what the sales person tells us or what’s in the marketing brochure, and this is generally based on historical performance.
Past performance ≠ Future performance
Warnings on product marketing are mostly ignored!
When last did you really think about the statement …
“past performance is not an indication of future performance”?
You see this line written in every investment product brochure and fund fact sheet.
If you want to buy a car and the brochure had a warning that the vehicle may not perform as stated in the brochure, wouldn’t you hesitate? I think you would exit that car showroom in a hurry. Yet, we buy investment products all the time that have these warnings.
Maybe we ignore them because it’s a standard warning on every single product regardless of the risk and therefore it loses its effectiveness, just like warnings on cigarette packs. There are other warnings about risk, such as high, medium or low risk indicators, but these also tend to be quite generic.
Research points to evidence that the attractiveness of product packaging is an influencer in sales. If the packaging was stark and the warning stood out in bold, maybe it would be more effective. What we see instead is pretty graphs showing investment performance that trends upward from left to right.
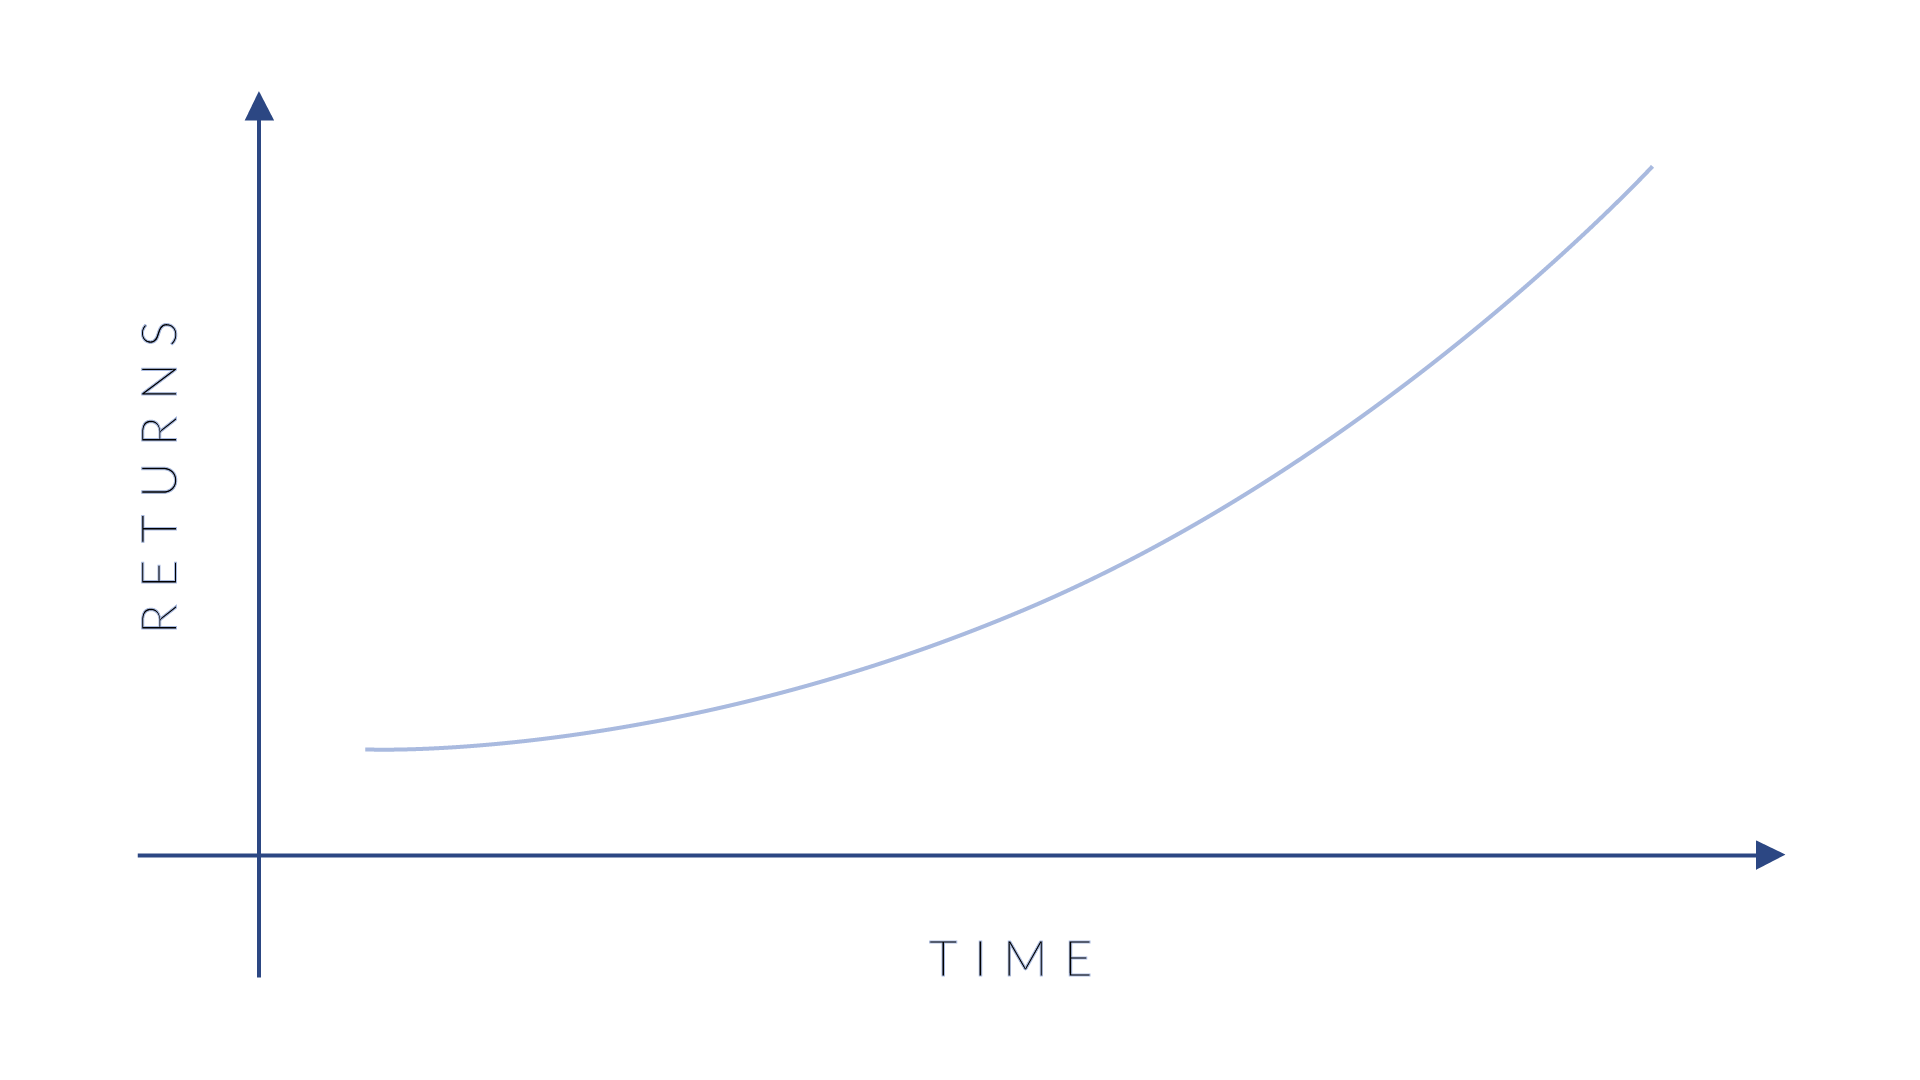
These can be very misleading, especially ones like long-term cumulative performance graphs. Unfortunately, they are also very seductive in moving us to buy the investment product.
The warnings on cigarette packs are there for a reason. Cigarettes have been conclusively linked to medical conditions which can kill you. Investment products, too, have these warnings and for good reason – you can lose some or all of your money – the stress of which, can also literally kill you!
When considering an investment we first and foremost look for those that will give us the best return on our money. Only then, as a secondary consideration, do we possibly consider the risks. Often by then it’s too late, as we’ve already been seduced by the prospect of great returns. This is one of the strongest reasons which leads people to gravitate toward fraudulent investment schemes. Ironically though, if it looks too good to be true then it usually is!
And even if it is true, it’s historical and most likely won’t be repeated into the future. There is absolutely no guarantee that good past returns will be repeated in the future. If anything, very good past performance is often followed by a period of poor performance. I’m making a generalisation here, but in essence, this is due to one of two powerful concepts in life and investing, namely Mean Reversion or Luck!
Thinking about Risk as a Probability
The standard dictionary definitions of Risk refer to the incidence of danger and resultant loss or injury. Crucially though, the words ‘possibility’ or ‘probability’ are included. But Risk in investing is generally expressed as volatility or worse, the difficult to understand term called Standard Deviation.
The academic investment definitions aside, the concept of Risk is different for every investor. Financial advisers seek to define their clients’ risk tolerance through questionnaires. Few are able to do this really successfully. This is in part because it’s hard to quantify and because risk tolerance is not a static thing.
If we experience a loss due to an event such as a burglary, we will naturally have a lower risk tolerance but this loss has absolutely nothing to do with our investments. This happens because we are emotional beings – we have feelings which influence how we see the world and how we act.
We may have difficulty understanding our own tolerance for risk, let alone others’. What is fairly universal is that pretty much all of us are risk averse. The behavioural bias – Loss Aversion – describes this trait well. Put simply, humans hate to lose, more than we like to win, an equivalent amount. However, often we don’t know how we’ll feel until we actually experience the loss and therefore we cannot easily define our tolerance for risk ahead of time.
Because Risk is not a certain loss but the probability of loss, it is helpful to think in probability terms. An easy way to understand this is to think about a coin toss. It is completely random and the probability of heads versus tails and vice versa is 50% because there are only 2 options with equal chance of being the outcome. A 50% probability of being wrong is very high – it’s a 1 in 2 chance, and not the odds you want to take when investing your money.
Risk vs Returns
The relationship between risk and return can be simply stated: you need to be compensated with more return for taking on more risk, or you must assume more risk if you target higher returns.
Required returns can be calculated mathematically but with risk it isn’t so easy. If you start with R100 and need to get to R200 over say 5 years, this is double your money or in percentage terms, a return of 100%, and approximately 15% return per annum for the 5 years. The risk you will have to take to achieve this type of return is difficult to precisely quantify. Traditional risk statistics will indicate risk in terms of how volatile the returns have been. It may be more helpful to think in terms of probabilities. If you are able to examine a long enough history of investment returns, you can then calculate the probability of achieving the targeted return, as well as of not achieving it. One can also go further and, in the instance of not achieving the target, one can calculate the likely result in terms of worst case outcome.
To examine the idea of probability, if the historical information shows that there is a 10% chance that the outcome is not 15% per annum but rather 5% per annum, this means there is a 1 in 10 chance that, based on history, you will receive 5% per annum and not 15%. Over 5 years this will compound to nearly 28%, which is 72% lower than your target. If you cannot stomach this potential lower outcome regardless of the 10% probability, then you will need to consider targeting a lower return that will increase your certainty (reduce your risk) but still likely leave you with less than the total 100% growth at the end.
Unfortunately there is no short cut here and no free lunches – you will always have to try balance your required return against the level of risk you are prepared to take. Therefore, putting aside the academic definitions of risk as volatility or standard deviation and instead thinking of risk in probability terms is a more practical approach and will surely help you on your investment journey.